We are going to look at a few examples, and then I will provide the code to do create the plots through Google Colab!
Goals:
- Learn to create a vector array.
- Manipulate vector to match an equation.
- Create beautiful plots with a title, axis labels, and grid.
Let’s go ahead and start by working on one of the simplest and most common equations.
y = x2
To do this, we are going to be doing a few things but first of all, we will be using 2 modules: Matplotlib.pyplot and Numpy.
NumpyIt is a Python library that provides. Is the fundamental package for scientific computing in Python.
- A multidimensional array object.
- Derived objects such as arrays and matrices.
and an assortment of routines for fast operations on arrays, including mathematical and logical:
- Shape manipulation
- Sorting
- Selecting
- Discrete Fourier Transforms
- Basic linear algebra
- Basic statistical operations
- Random simulation
- much more
Is a collection of command style functions that make matplotlib work like MATLAB. Each pyplot function makes some change to a figure:
- Creates a figure.
- Plots some lines in a plotting area.
- Decorates the plot with labels.
- etc.
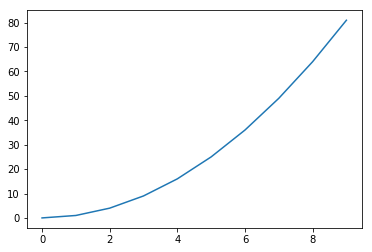
We want to plot from 0–10 on the x-axis, but let’s think about what each value would be: x = [1,2,3,4,…,9,10] y = [1,4,9,16,…,99,100] In this case, every value in y is just the x value at the same index squared. Now that we have all of these values, we can just put them into a python variable and plot!
-
Import our modules that we are using.
import matplotlib.pyplot as plt
import numpy as np
-
Create the vectors X and Y.
x = np.array(range(10))
y = x ** 2
-
Create the plot
plt.plot(x, y)
and then the resulting image:
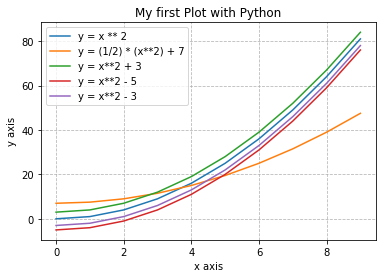
I will go into a few options that we can add to make our plots look better!
- When plotting add a label for the legend.
- Adding a title.
- Add X and Y label.
- Add a grid with opacity of .9 and linestyle of ‘-‘.
- Show the legend.
Finally, you can add multiple plots to the same figure.
 Link:1 matplotlib pyplot.ipynb
